Introduction
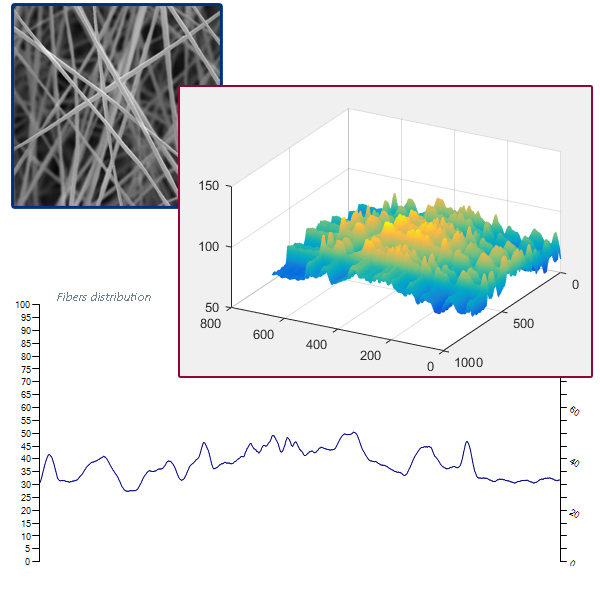
With NanoTPA you can statistically analysis texture of the nano fibers from SEM images. Using knitter algorithm, statistical calculation outputs of software gives information about porosity and fiber distribution of nano fiber sample. These statistical information includes:
- Fibers distribution (Min, Max ,Mean)
- Porosity distribution (Min, Max ,Mean)
- Variance
- Standard deviation
Also, 2D and 3D graphs help better understanding of fibers/porosity distribution in tissue.
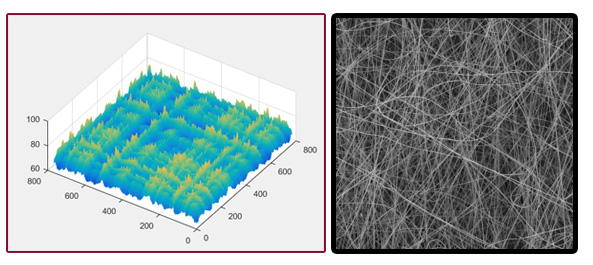
There is no need to send your samples physically; only SEM images are enough. The resolution of images are important on the precision of calculations but zooming doesn’t make significant difference unless in case of large variance and standard deviation in distribution of fibers across the tissue, in that case several images from the sample tissue should be analyzed and averaged.
Software name : Nano Texture Profile Analysis (NanoTPA)
Version : 1.0 - 2018
Designer : Ali Ebrahimi Pure
Sample citation format : A. Ebrahimi Pure, Nano Texture Profile Analysis 1.0 ( NanoTPA ), http://nanotpa.ir, analysis date , analysis code : (your analysis code)